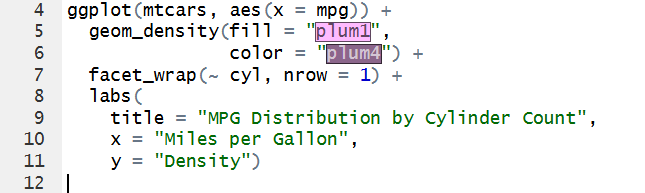
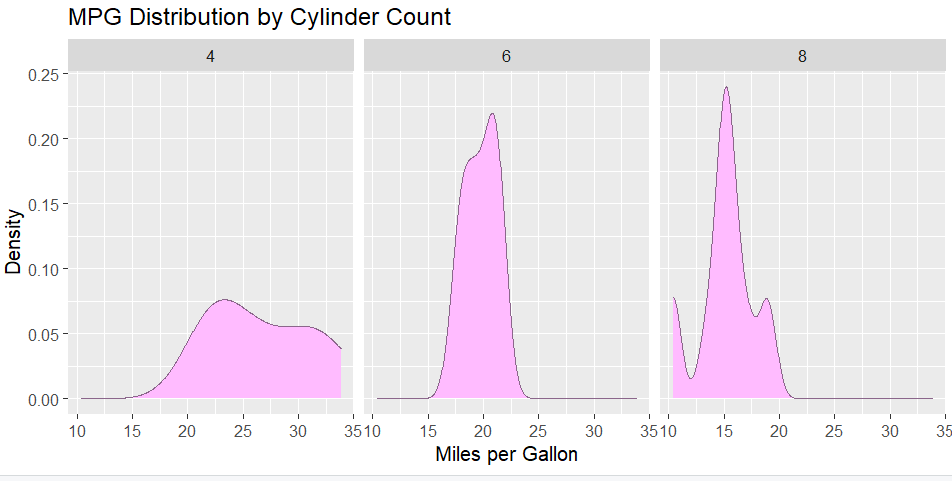
Using RStudios built in dataset mtcars and ggplot2 , we will be creating visualizations for distribution analysis. I decided to first create a density plot to see the distribution of miles per gallon across the number of cylinders (4, 6 or 8):
This visualization shows the spread and distribution of cars MPG by number of cylinders. According to Few, distribution visualizations have 3 key characteristics, spread, center, and shape.
4 cylinder:
Spread between 15-35 MPG
Center is a little less than 25 MPG
Shape is leaning towards the right and mid to higher values
6 cylinder:
Spread between 15-25 MPG
Center is a little above 20
Bell shaped, with values close together
8 cylinder:
Spread between 10-20 MPG
Center at 15 MPG
Has multi modal shape, with value concentrated mostly at 15 MPG, and then 10 and 20 MPG
Looking at the graphs and these characteristics, we can notice patterns of:
cars with 4 cylinders tend to have mid to high MPG of around 20 and above
those with 6 cylinders stay in the mid range of 15-25 MPG
cars with 8 cylinders tend to have a lower MPG, of 20 and below
It could be inferred that the more cylinders a car has, the more fuel is consumed.
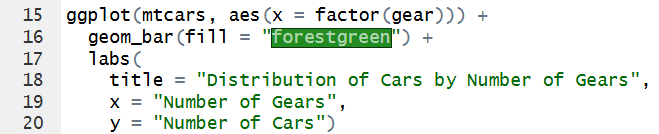
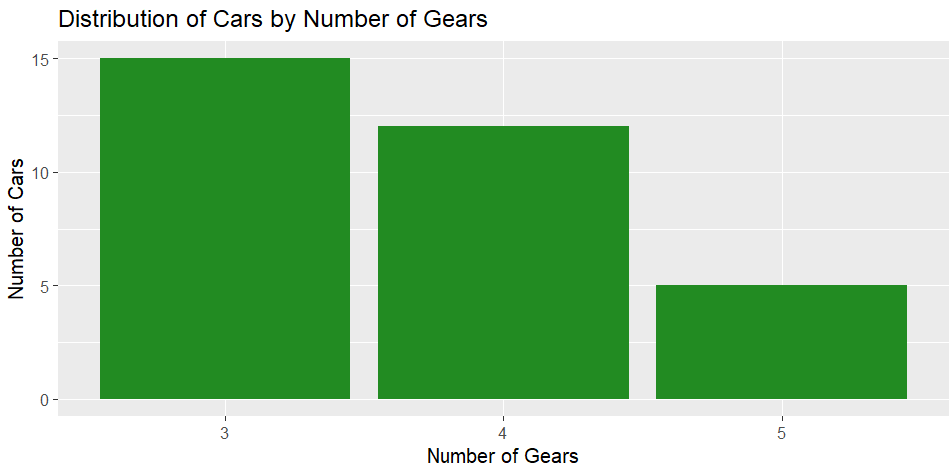
For a bar plot for categorical distributions, we can look at
The graph is skewed to the left, showing a higher distribution of cars having 3 gears, and the number progressively lowering from 4 to 5.
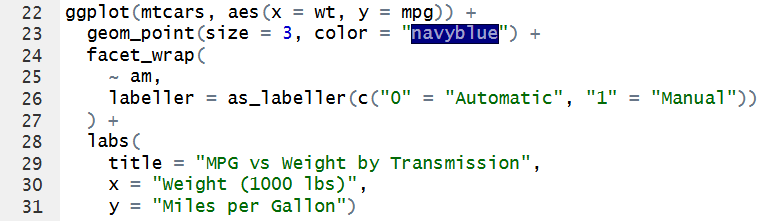
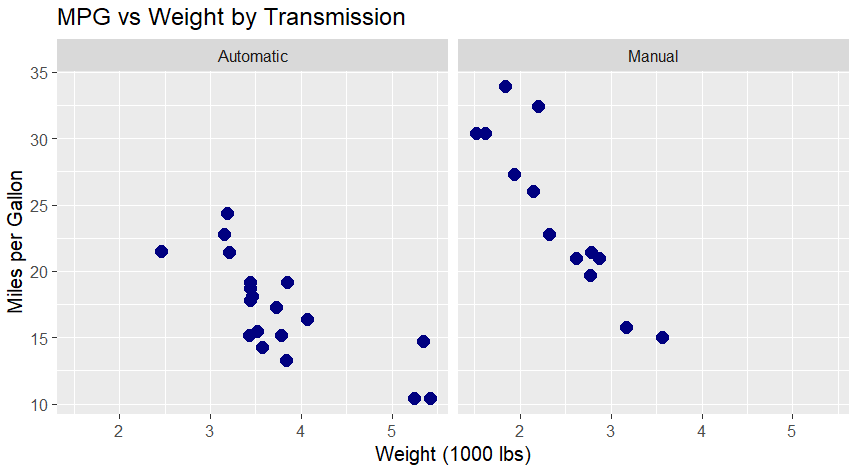
Finally, for scatter plots, we can compare automatic vs manual transmission MPG by the cars weight:
Just from looking at this visualization, we can see that manual cars in the dataset have higher MPG the lighter the car is. Automatic cars tend to have a lower MPG, but some automatic and manual cars have similar MPG values, so transmission type alone does not explain fuel efficiency.
I agree with Few’s critique of how distributions are commonly presented in visual analytics. Using averages can hide important details and fail to show the full picture of the data. I also agree that box plots are not always the best way to visualize distributions because they can hide individual data points and other important patterns. Additionally, our eyes tend to focus on the box, which may lead us to assume that this is where the data is most concentrated, even when that may not be the case.
Leave a Reply