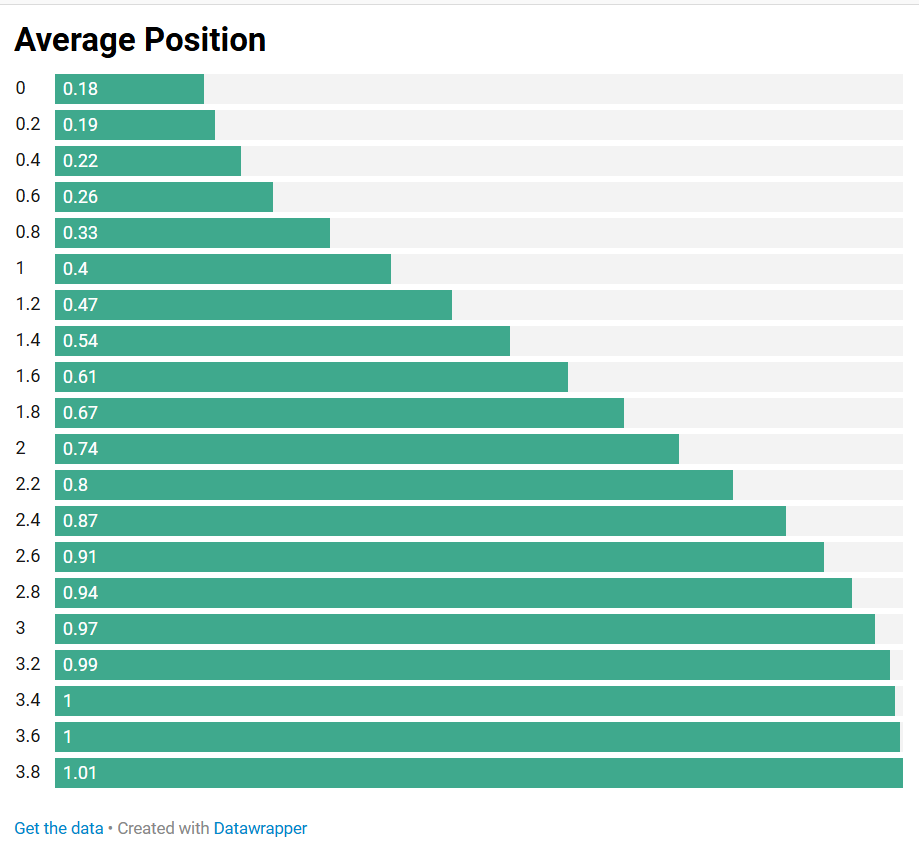
For this assignment, we are asked to create a ranking chart and a part-to-whole chart, using a given dataset containing Average Position and Time. For the ranking chart, I created an ordered bar chart using Datawrapper:
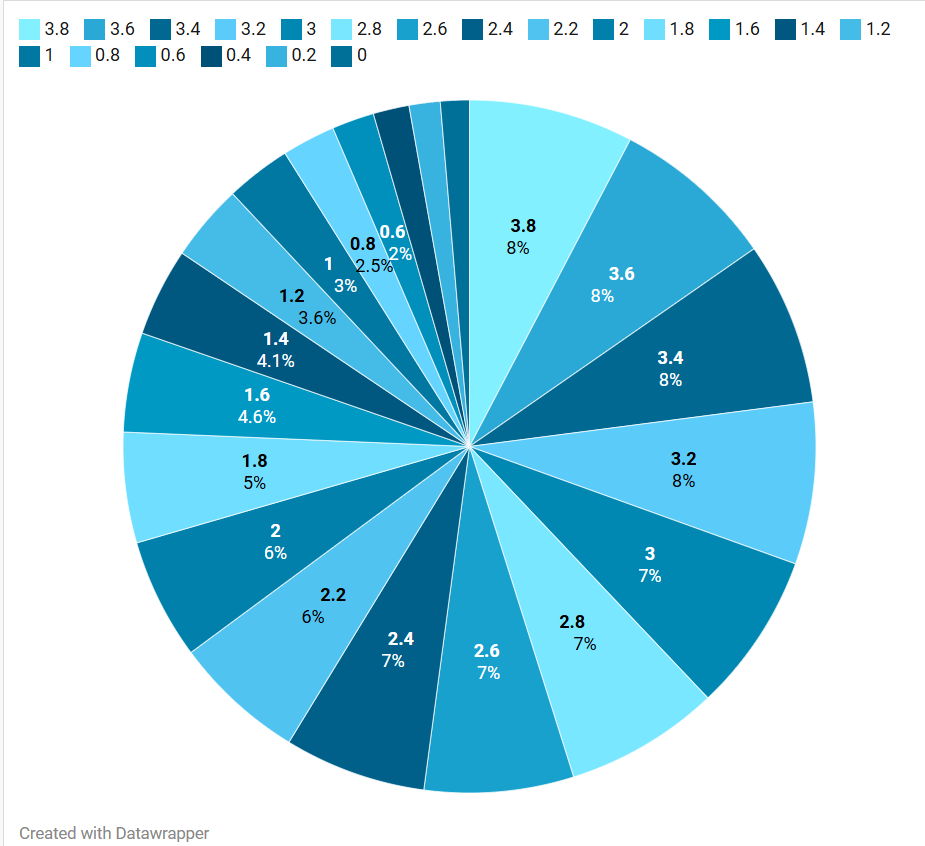
Then, for the second chart, a part-to-whole visualization, I created a pie chart:
The ranking chart shows the average position according to the time. Looking at this, we can see that the increase isn’t perfectly linear, starting off slow then increasing more rapidly before slowing down as it reaches 1. The ranking design helps highlight the progression of average position and makes it easy to compare the values across the different time points. This shows that average position generally increases over time, with the most noticeable changes occurring in the middle of the range.
The second chart shows the average position by time. The pie chart shows the proportion of the total average position represented by each time point. This allows us to see which time points make up a larger or smaller share of the overall average position. However, a pie chart is not ideal for this data because the values represent position over a continuous period of time, rather than separate parts that naturally make up a whole.The Part-to-Whole design does provide another way of viewing the data by showing how each time point contributes to the overall total, which can highlight the time points with larger average positions. However, its main limitation is that it does not show the order or progression of time clearly.
The ranking chart communicates the trend more clearly, while the part-to-whole chart provides a different perspective on the relative contribution of each time point. This demonstrates that part-to-whole can be useful for showing proportions, but it is less effective when the data represents a continuous trend rather than distinct parts of a whole.
Leave a Reply