For this assignment, we will be creating basic graphics using R Studio. I will be using R’s built in dataset mtcars.
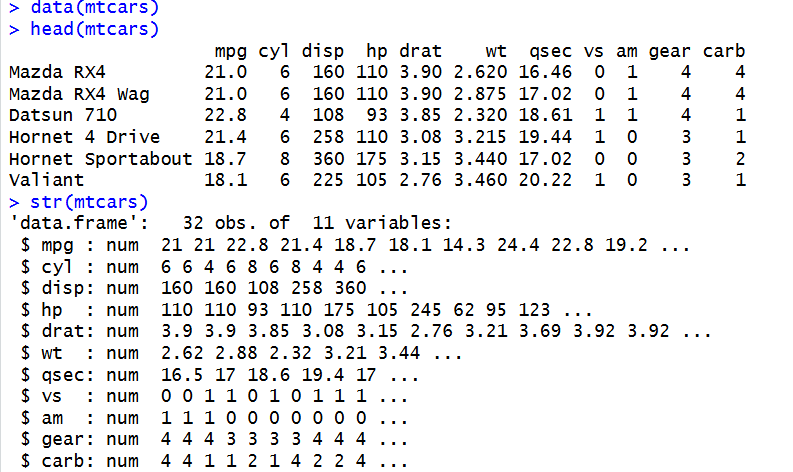
To start, we will inspect the columns and format of the dataset, and check its structure:
We can see that there are 11 variables and 32 observations. This means there are 32 car types in the dataset, and 11 different columns of measurements/attributes such as miles per gallon, number of cylinders, and engine displacement.
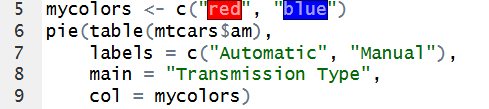
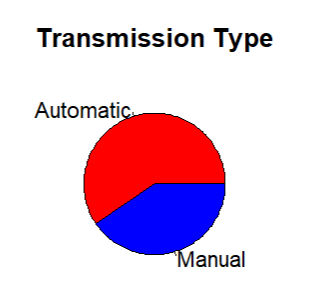
For a pie chart visualization, I decided to look at transmission type. I will create a pie chart showing what percent of cars have an automatic transmission vs. a manual transmission:
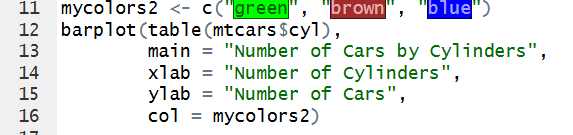
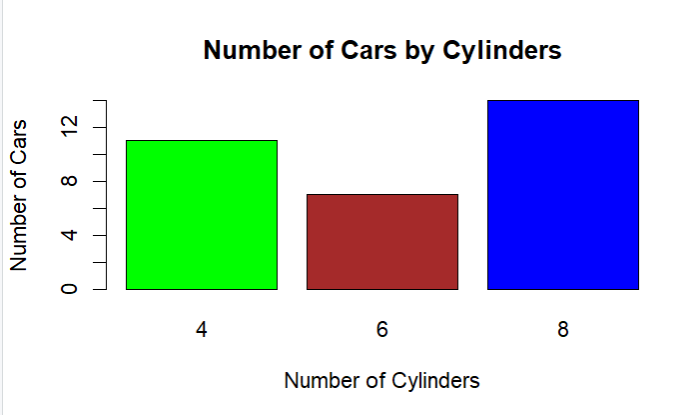
For a bar chart, I compared the amount of cars with 4, 6, or 8 cylinders:
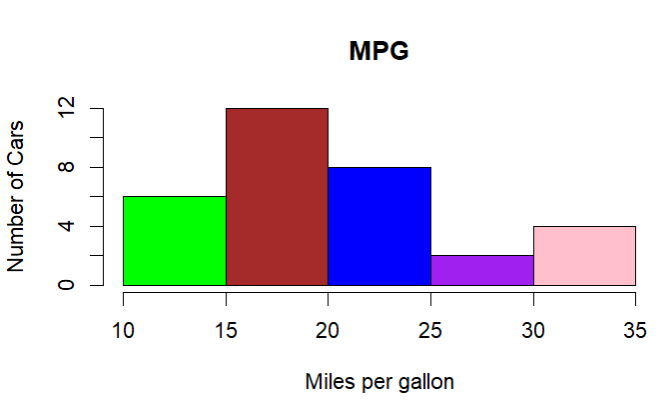
For the histogram, I’ll compare mpg between cars:
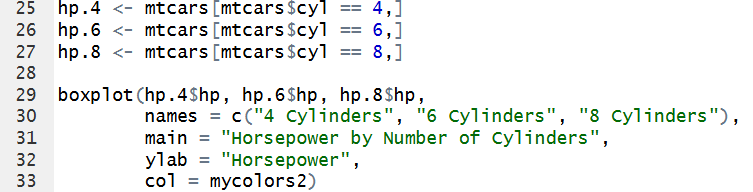
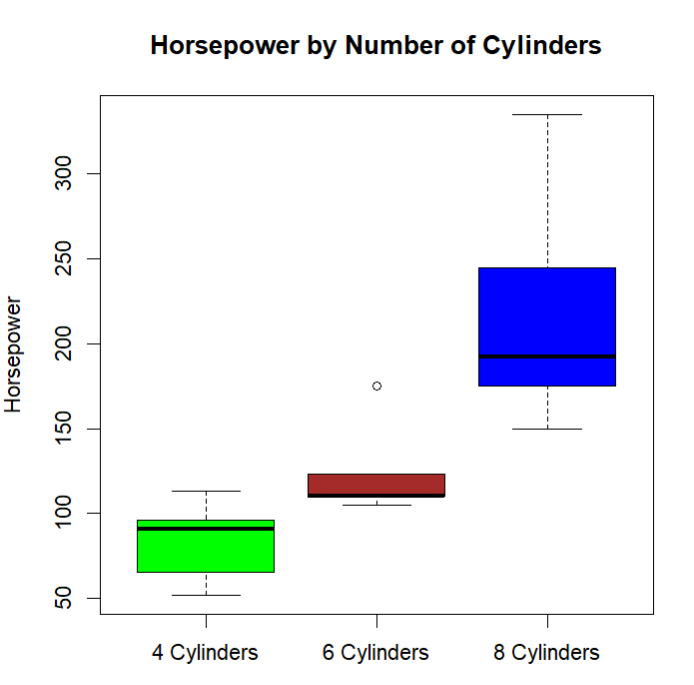
Finally, the box plots will by showing the relationship between horsepower and number of cylinders:
In the pie chart, we can easily understand from a glance that there are more automatic cars than manual. The bar chart also clearly shows that most of the cars have 8 cylinders, then 4, and the least amount of cars have 6. The histogram is easy to understand, and its obvious that most cars have a MPG between 15-20, and the least between 25-30. Finally, the box plots also make the trend that more cylinders = more horsepower clear.
I think these simple visualizations do a good job of communicating the main ideas in the data and are useful for conducting a basic descriptive analysis. The visualizations make it easier to recognize patterns and compare different aspects of the mtcars dataset without having to look through the raw numbers. Some of my choices do not completely follow the recommendations discussed by the authors, however. For example, Yau explains that darker colors are typically used to represent greater values, while lighter colors represent lower values. In my visualizations, I just used different colors to separate categories rather than using color to represent the size of a value, so my charts do not follow this guideline. At the same time, my visualizations do follow the authors’ broader idea that graphs should make comparisons easier for the viewer. Having the box plots and other graphs displayed clearly allows the viewer to compare groups visually. I think the basic visualizations are appropriate for a simple descriptive analysis because they make the patterns and differences in the data easier to understand.

Leave a Reply