For this assignment, we will be comparing three visualization systems in R: base graphics, lattice, and ggplot2. I’ll be using the built in dataset iris.
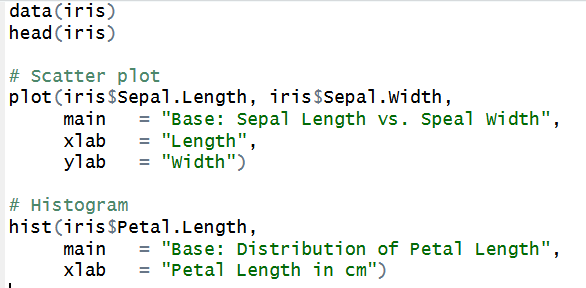
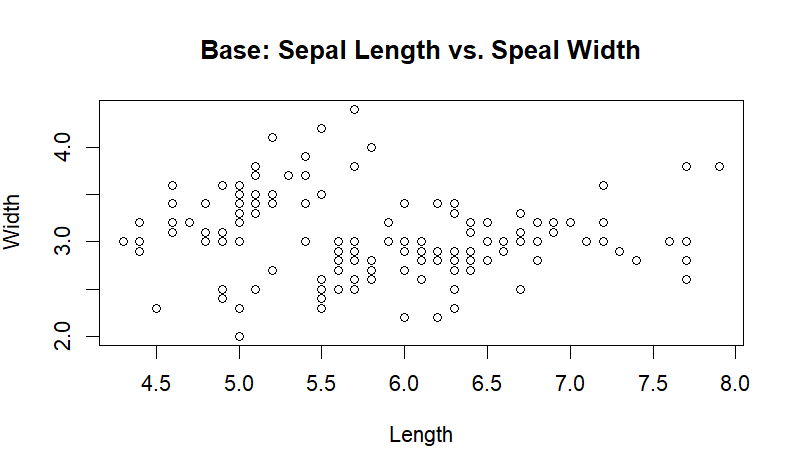
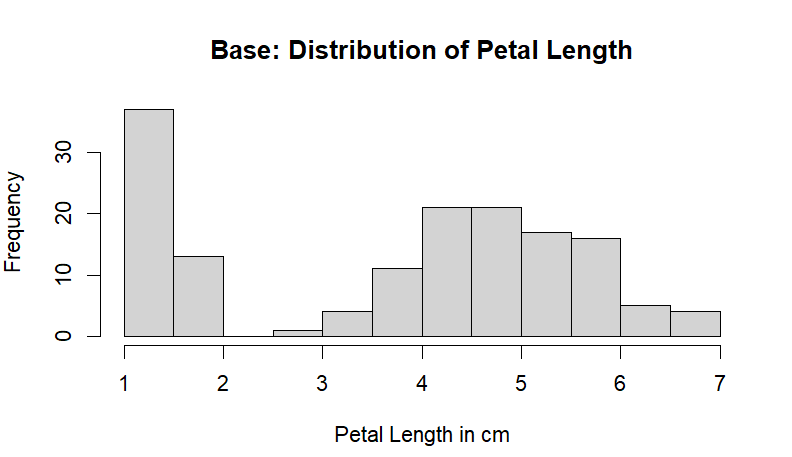
To start, using R’s base functions and graphics, I created a scatter plot comparing flower sepal length vs width. Then, a histogram showing the distribution of petal length.
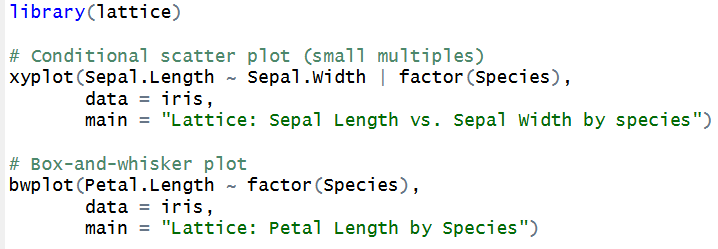
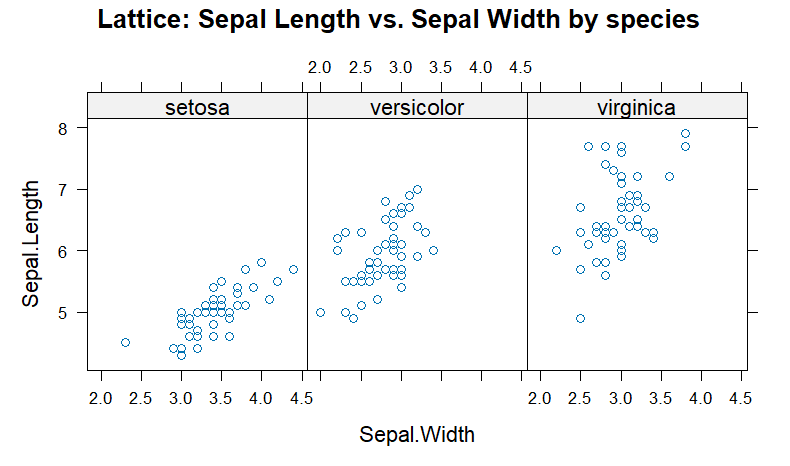
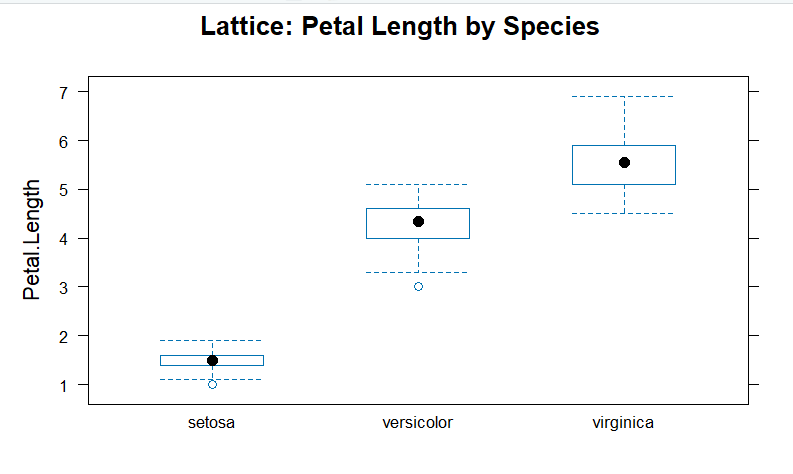
Then, using the lattice package, we can compare sepal length and width by species using a conditional scatter plot. We can also look closer at the petal length distribution by grouping the data into species.
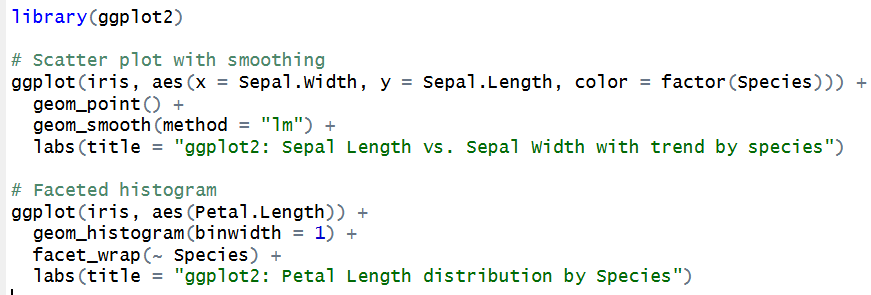
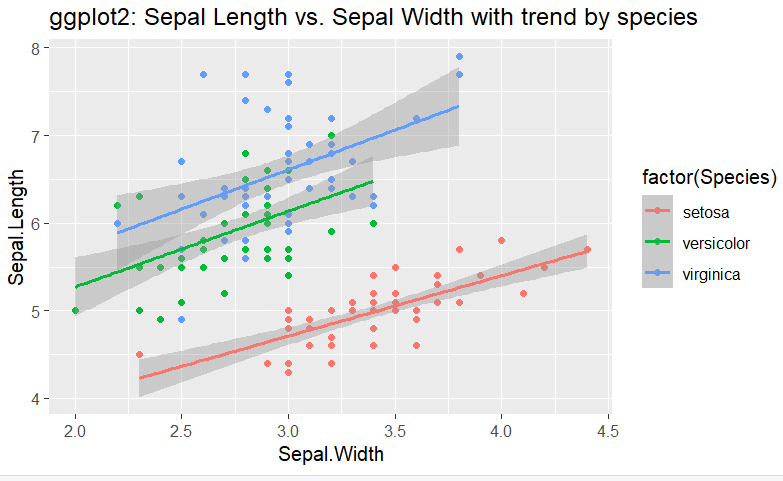
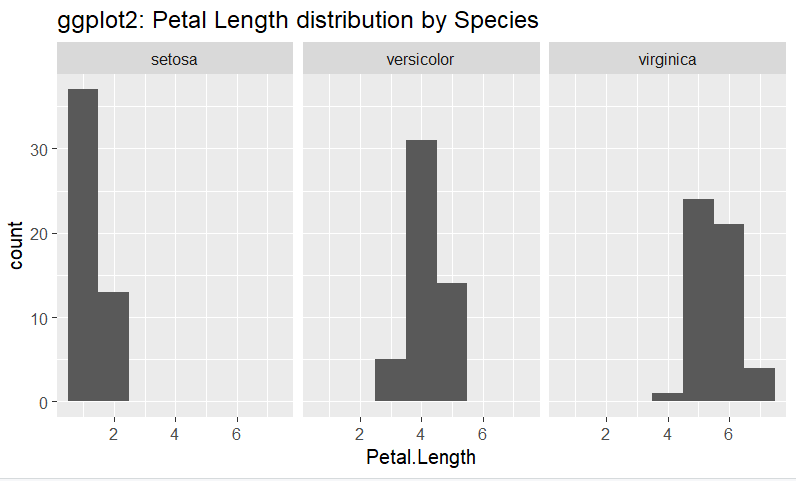
Finally, using ggplot2, we can look even further at the relationship and patterns in the data between sepal length and width by species, and at petal length by species.
Between the base, lattice, and ggplot2, I think base has the most straightforward syntax, but the most basic results. I really liked both of the lattice visualizations and the ggplot2 scatter plot, and think they produced the most publication-quality output. Grouping by species allows for more insigts into patterns, and the visuals are clear and easy to understand. Both the lattice and ggplot2 syntax are more complicated than the base R, but overall they are still easy to understand, intuitive, and not needlessly complex. However in terms of minimalism, the lattice code was the simplest with best results. I didn’t face any challenges when switching between any of the 3.
Leave a Reply