I will be using Rs built in dataset mtcars in order to explore relationships between variables using correlation or regression analysis and visualize them using ggplot2.
I will use cor() to compute correlation matrices, lm() for linear regression models, and ggplot2 for visualizations with geom_point() for scatter plots, stat_smooth(method = "lm") to add regression lines, and facet_wrap() or gridExtra to arrange multiple plots.
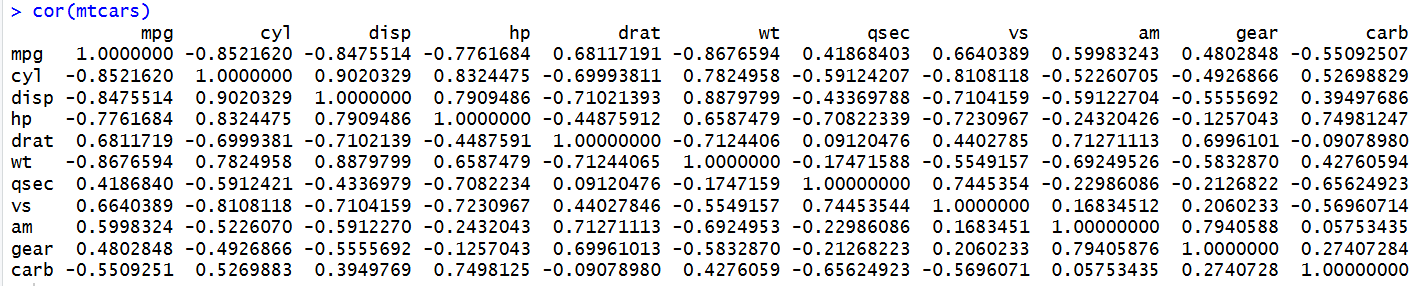
Correlation values range from -1 to +1. A value of +1 indicates a positive correlation, meaning that when one variable increases, the other tends to increase as well. A value of -1 indicates a negative correlation, meaning that when one variable increases, the other tends to decrease. A value of 0 indicates little or no linear relationship between the variables.
The cor(mtcars) function calculates a correlation matrix to show the strength and direction of relationships between variables in the dataset. So for instance, the results show a strong negative correlation between mpg and wt, meaning heavier cars tend to have lower fuel efficiency. There is also a strong negative correlation between mpg and hp, suggesting that cars with higher horsepower generally have lower fuel efficiency.
In R, lm() is used to create a linear regression model, which helps us understand relationships between variables and predict an outcome based on one or more predictors.
We can look at the relationship between mpg and wt further:
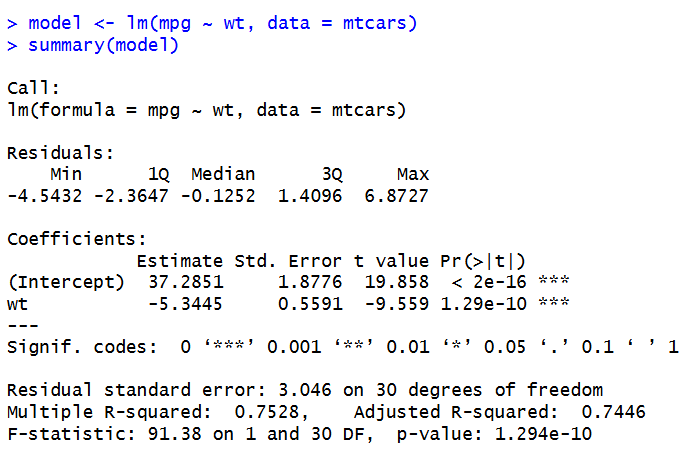
The linear regression model shows a negative relationship between car weight and fuel efficiency. The weight coefficient is approximately -5.344, meaning that for every increase of 1,000 pounds in car weight, fuel efficiency is predicted to decrease by approximately 5.34 miles per gallon. The intercept is approximately 37.285, meaning the predicted MPG when car weight is zero. The model has an R squared value of approximately 0.753, meaning that car weight explains around 75.3% of the variation in fuel efficiency in this dataset. It seems heavier cars generally have lower fuel efficiency.
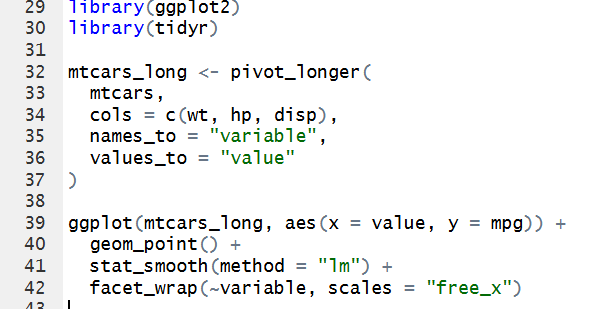
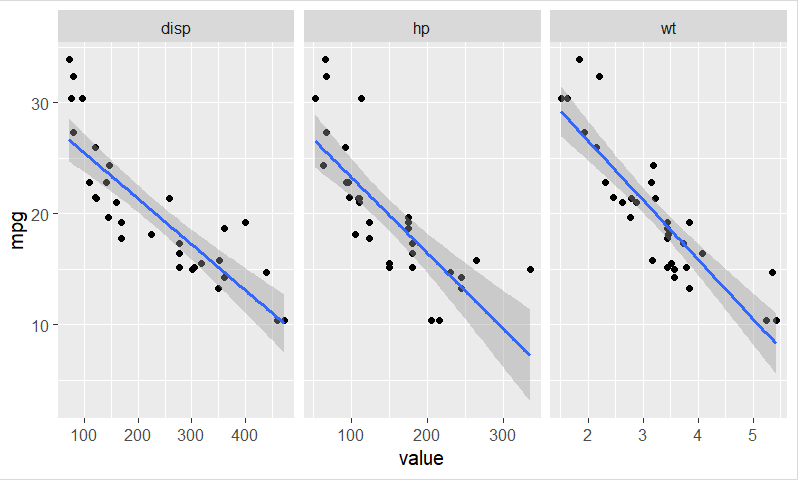
I created three scatter plots with regression lines to show the relationships between MPG and weight, displacement, and horsepower. In all three , there is a negative relationship, so as these values increase, MPG generally decreases. Heavier cars and cars with higher horsepower or displacement tend to have lower fuel efficiency. Using a grid layout with facets made it easy to compare these characteristics because all three charts are displayed next to each other, making the patterns easier to identify. I also used a relatively neutral color scheme to keep the visuals simple and easy to read, although I kept the regression line blue because I felt it looked better than a gray or more neutral line. I agree with Few’s recommendations for keeping visualizations clear and avoiding unnecessary clutter. However, I think some flexibility is important because a color choice can improve the appearance of a graph while still making the information easy to understand.
Leave a Reply