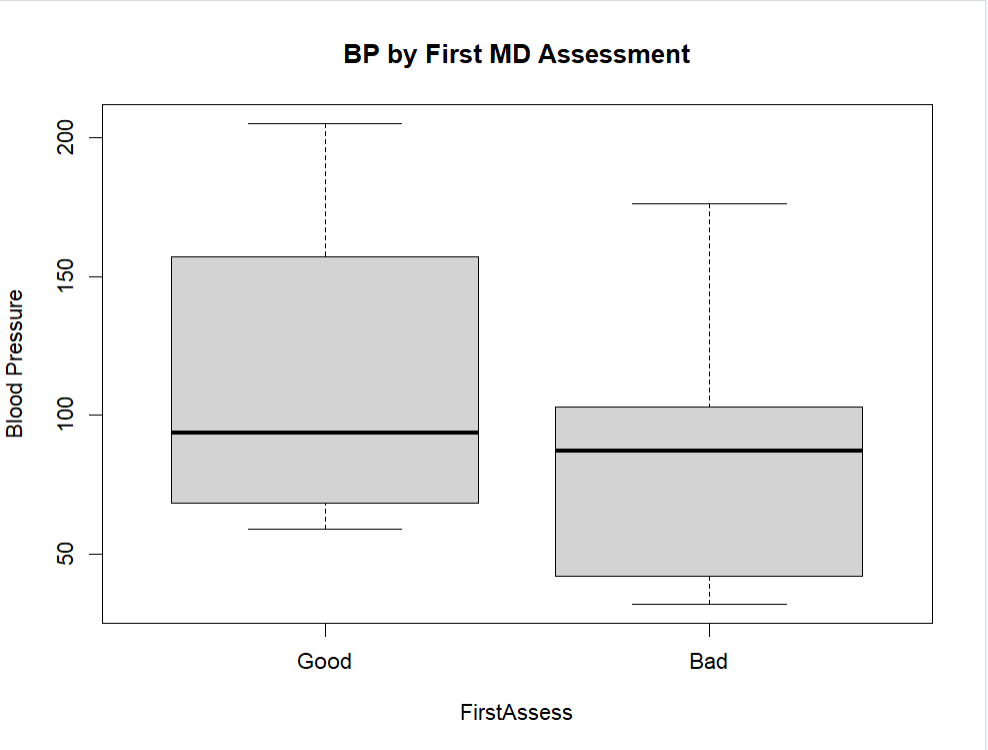
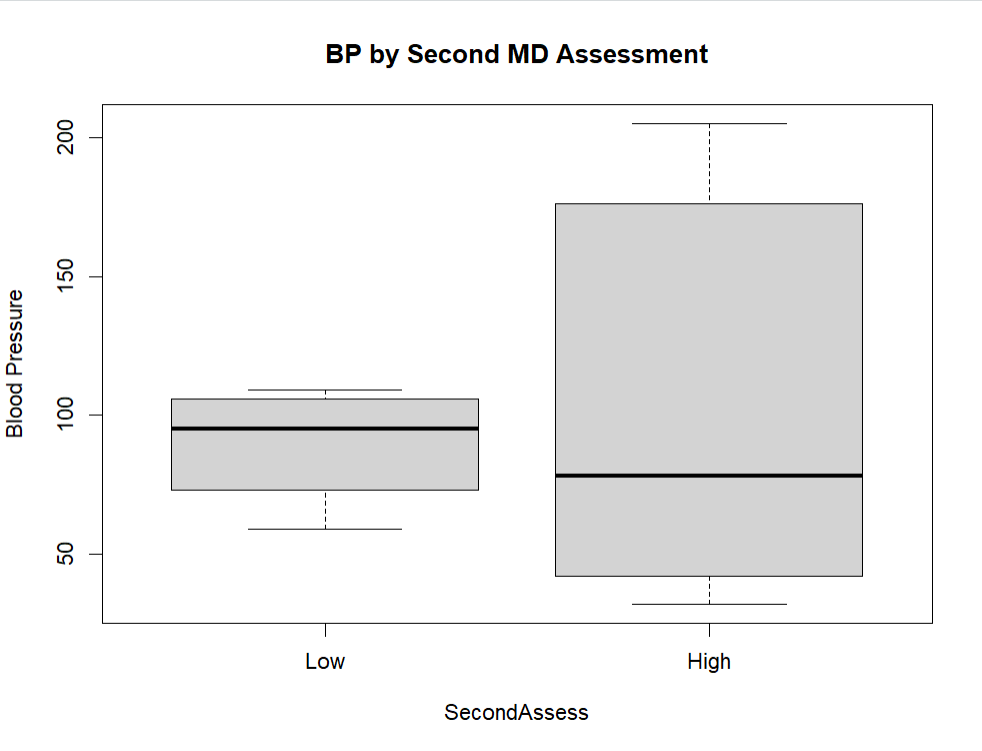
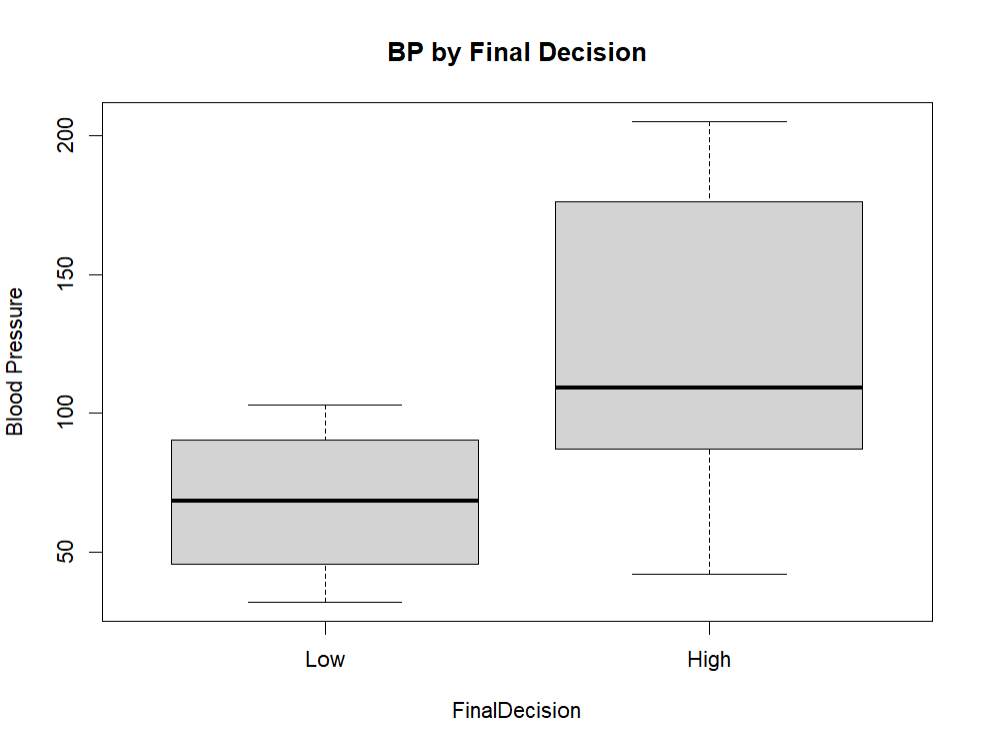
Looking at the first assessment, the median blood pressure for the ‘good’ and ‘bad’ groups appears to be fairly similar. Additionally, the ‘good’ group seems to have slightly higher blood pressure values overall than the ‘bad’ group. For the second assessment, the ‘high’ group has a much wider range of blood pressure values, ranging from 32 to 205, compared with the ‘low’ group, which ranges from 42 to 103. Finally, the final decision seems most accurate, as the patients categorized as ‘high’ do seem to have higher blood pressure values overall compared with those categorized as ‘low’.
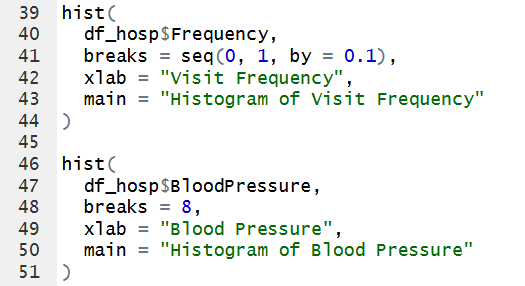
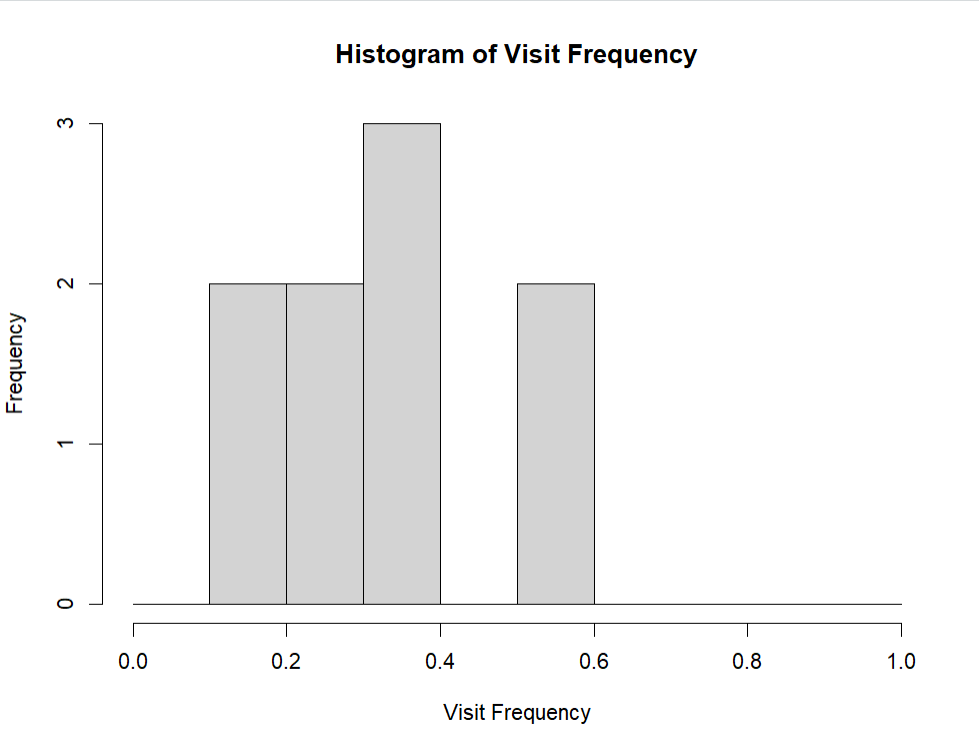
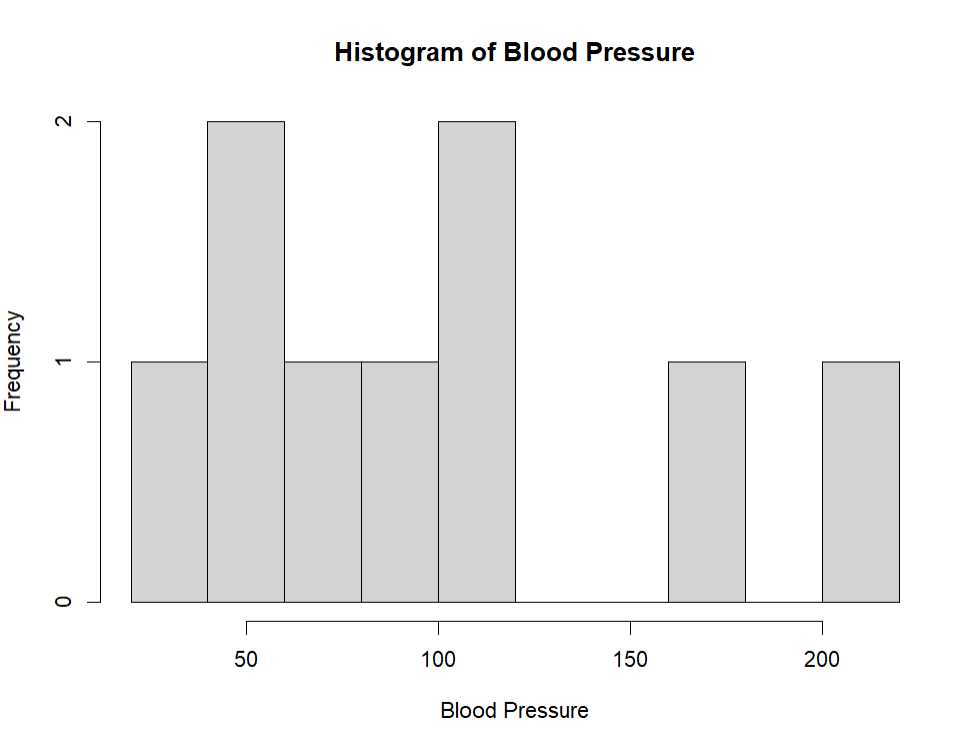
Looking at the first histogram of visit frequency, there doesn’t seem t be any outliers, and the visit frequency ranges from 0.1 to 0.6, with the mode being 0.4. In the blood pressure histogram, most seem to be concentrated in between 32-109, with 2 outliers on the higher end at 176 and 205.
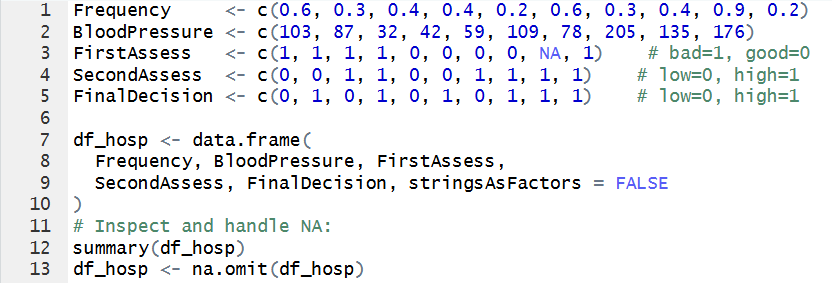
When dealing with the NA value, we just removed that patients entire data from our dataset. If it was still included, they may have caused outliers/skewing in the visualizations. For instance, their visit frequency was the highest, and would have been an outliers at 0.9. Additionally, their blood pressure was 135, which would have also caused the histogram to be skewed to the right alongside the other to higher outliers.
Overall, the data shows some differences in blood pressure levels among the patients, which could be important to consider in a clinical setting. However, the data we are using is made up, and should not be used in making clinical decisions. Out dataset is also small and limited, with only 10 patients. With a sample size this small, even if we were using real data, it should also not be used for medical judgement. Like we saw, just having a few outliers when the sample size is small could lead to a large skew in results. There is simply just not enough data to draw accurate conclusions.
Leave a Reply