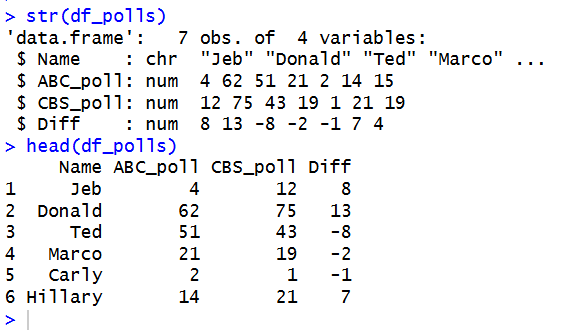
To analyze ‘poll’ data in R, we start by defining out data, compiling it into a data frame. and then inspecting it:
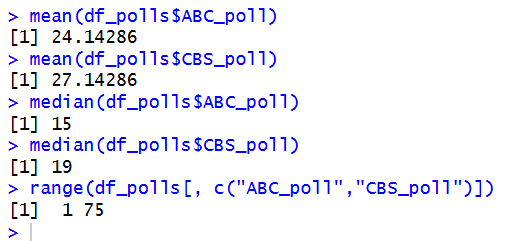
Then, we find the mean, median, and range of each poll:
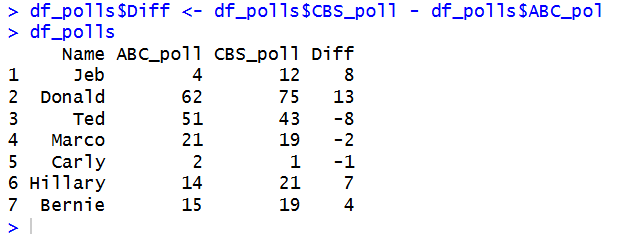
And add a column for the difference between CBS and ABC:
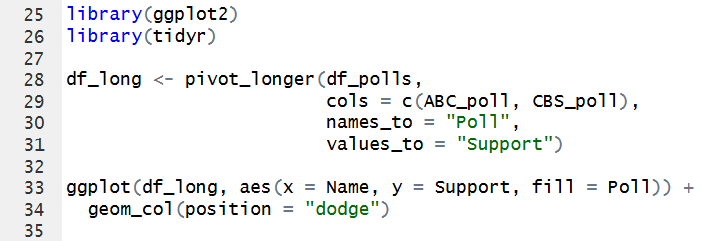
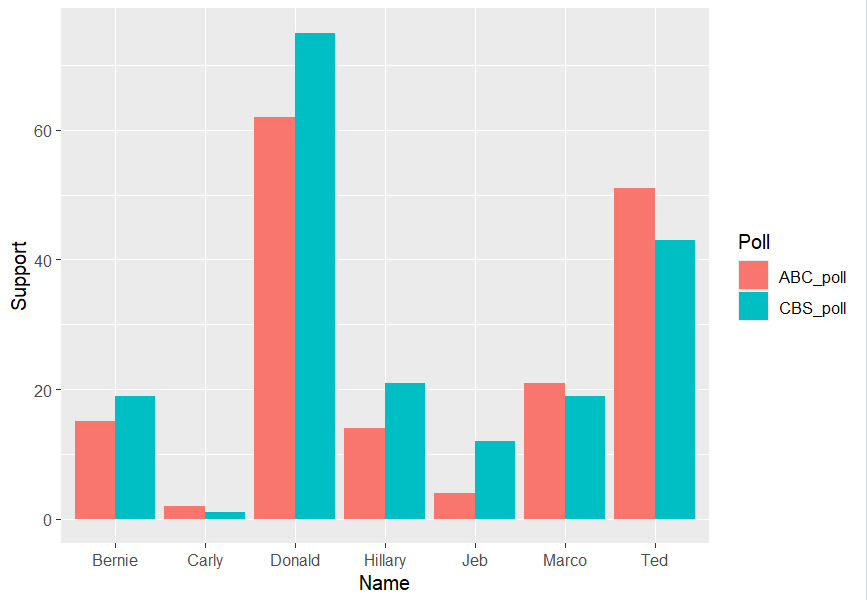
Finally, we generate a plot to display and visualize the poll results and their differences:
Looking at the poll data, the biggest differences between the ABC and CBS polls are for Donald, Jeb, and Ted. Donald has the largest difference at 13 points, with 62 in the ABC poll and 75 in the CBS poll. Jeb has a difference of 8 points, while Ted also has a difference of 8 points, but in the opposite direction. We can see that different polls can have noticeably different results for the same candidates.
Using made up data can be limiting because it cannot lead to real or actual discoveries. It can be useful for showing possible patterns and helping us learn how to analyze data, but it does not provide the details that would come from real observations. To get real polling data, I would look for research organizations that collect and share polling information. Organizations such as the Gallup Poll and Pew Research Center provide real survey and polling data that can be used for analysis. I would also compare data from multiple reliable sources and check how the data was collected to make sure the results are accurate.

Leave a Reply