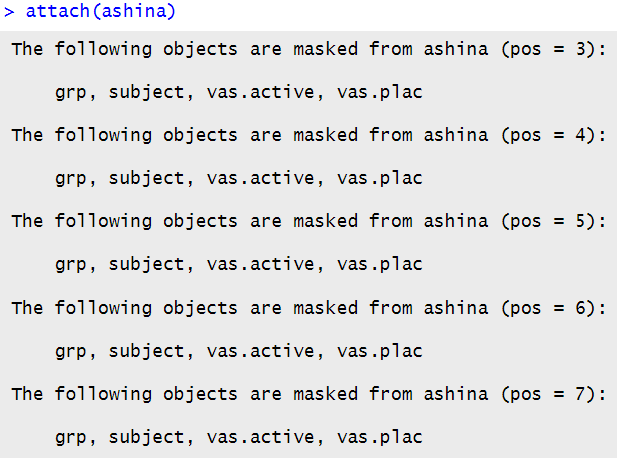
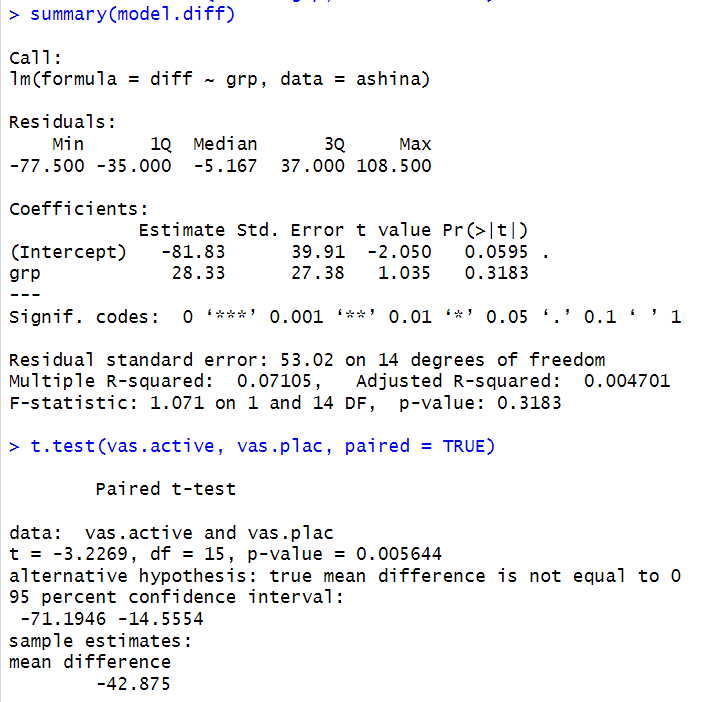
For this assignment, we are asked to use built in dataset ashina. This data contains additive effects on subjects, period and treatment. We are asked to compare the results with those with those obtained from t tests. Results below.
Comparing the additive model results for the Ashina data with the paired t-tests shows that both methods lead to similar conclusions, but the additive model gives more detail. The t-tests compare the active treatment (vas.active) and placebo (vas.plac) directly, showing whether there is a significant difference between them. The additive model, however, also accounts for differences between subjects and periods, which helps explain variability in the data. Some differences that look significant in the t-test may be adjusted in the additive model when considering these other factors. This means the additive model gives a more complete view of what is affecting the results, while the t-test provides a simpler comparison. Overall, both methods show that the treatment has an effect, but the additive model explains more about why the differences occur.
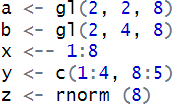
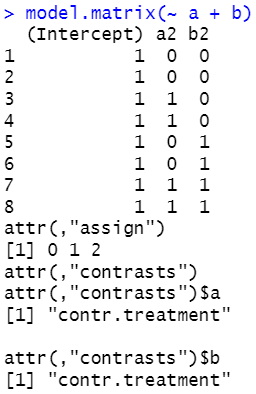
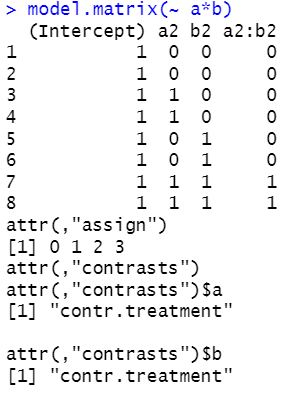
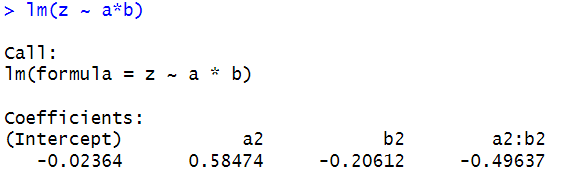
12.3 We are asked to look at the definitions below, and to generate model matrices for z ~ a*b, z ~ a:b, etc.
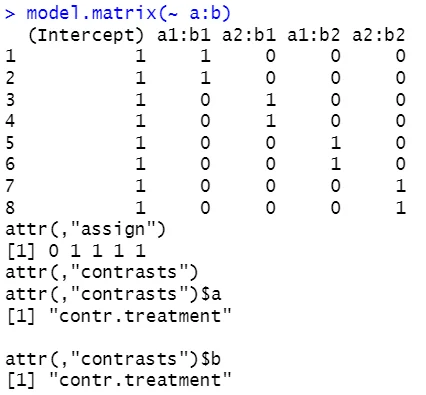
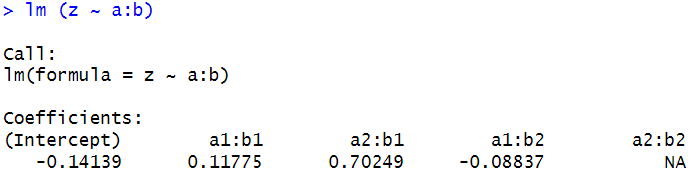
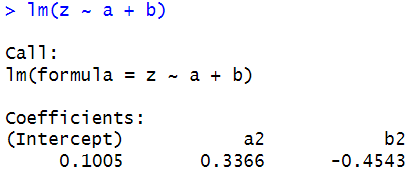
The model including only the interaction (a:b) sometimes produced singularity warnings, which occur when there isn’t enough data to estimate all coefficients. With 8 observations and 4 interaction levels, some combinations lack sufficient information, making the model “rank-deficient.” In contrast, the main-effects-only model (a+b) fit without any issues because it has fewer coefficients relative to the number of observations. The model with both main effects and interaction (a*b) fits successfully but demonstrates that adding interaction terms increases model complexity.
While interactions can provide valuable insight into relationships between factors, they require sufficient data to avoid singularities. Examining model.matrix() before fitting models helps predict where singularities might occur and better understand how R encodes factor levels.