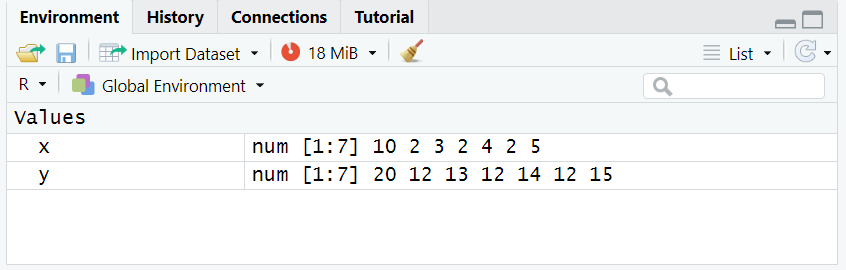
For this week, we were given 2 data sets, each consisting of 7 observations. In RStudio, I assigned Set#1 to the variable x, and Set#2 to the variable y.
We are asked to find the mean, median, and mode under Central Tendency, and to compute the range, interquartile values, variance, and standard deviation under Variation. I did this using the built in R functions, such as mean(x), sd(x), var(x), etc. All functions and output shown below:
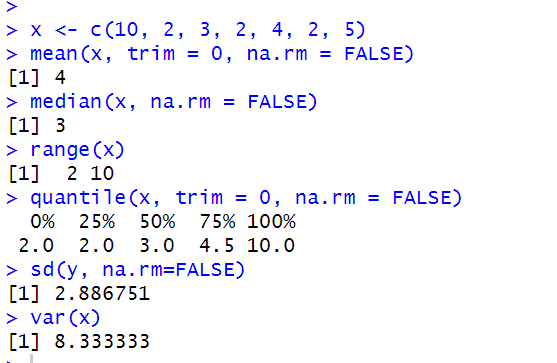
For x, I used 4 different functions to get the mean, median, range, and interquartile values. As well as trim to drop some observations, and na.rm=FALSE to indicate to not strip NA values.
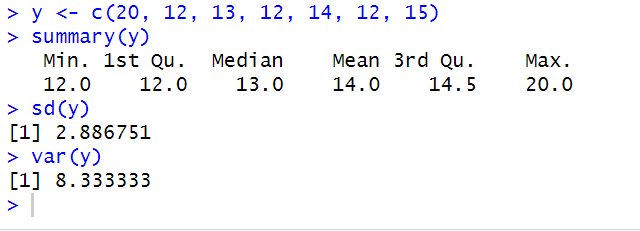
With y, on the other hand, I just used 1 summary function to get all of these.
Using various functions, I was able to get the following results for each data set:
mean:
median:
range:
interquartile:
variance:
standard deviation:
Set#1:
4
3
2 – 10
2, 2, 3, 4.5, 10
8.333333
2.886751
Set#2:
14
13
12 – 20
12, 12, 13, 14.5, 20
8.333333
2.886751
R does not have a function to calculate the mode of a dataset, and the mode() function returns the storage mode of an object. The mode of Set#1 is 2, and for Set#2 is 12.