October 29, 2025
For this assignment, we are asked to conduct an analysis of variance and regression to data from one of R’s built in datasets, ‘cystfibr.’
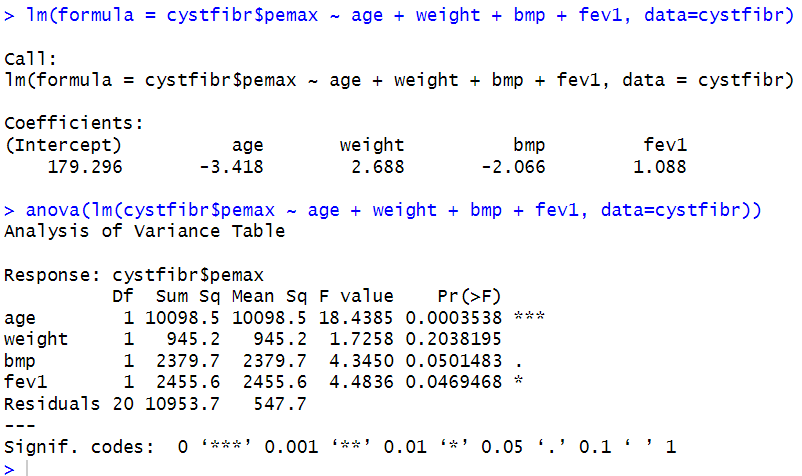
After loading in the dataset, I used R’s anova function to see the following:
In this dataset, PEmax is the outcome variable, and is effected by the variables: age, weight, bmp (body mass percentage), and fev1 (a measure of lung function.)
Anything that improves breathing strength (like better lung function or more muscle mass) should make PEmax higher. Anything that weakens the system (aging, disease effects, high body fat) may make PEmax lower.
Looking at the coefficients/intercepts can give us the following insights:
For the predictors, age has a negative coefficient (-3.418), which suggests that PEmax slightly decreases as patients get older. Though in this model the p value shows this isn’t statistically significant. So age may not have a direct effect here.
Weight shows a positive and significant effect: for every unit increase in weight, PEmax increases by about 2.688. That likely reflects stronger respiratory muscles in heavier (and possibly healthier) patients.
BMP (body mass percentage) goes the opposite direction: -2.066 per unit, also significant. This indicates that a higher fat percentage may be associated with lower respiratory strength.
Finally, fev1, a measure of lung function, has a small but significant positive effect (1.088). Better lung performance = higher PEmax, which matches what we’d expect clinically.